Explore urban data
in a new urban agenda

Urban systems are hyper-connected to many layers, from global systems through local neighborhoods to rural countryside. All this complexity can now be analysed with big data and machine learning, we know how residents and visitors move, what vehicles they use and can dissect population with Clustering and Classification techniques to better understand urban sociology. More data available, means also more layers added to measure urban quality, like public health, pollution, or neuroscience show the interconnection with urbanscapes and other disciplines. Environmental issues linked with climate change are essential part of new city planning demands, and are demanding a quicker adaptaion in time.
City planning then is more specific and diverse, demanding more concise and clear approaches. Despite the deluge of high-tech smart cities, the protocol of adapting data mining to planning decisions is far from being a standard. And yet many contradictions arise between actors and stakeholders: if an urban growth model determines that human-centered urbanism and architecture is showing a better performance, how this can be shaped in reality? Theories like urban assemblages are showing some dependencies between materials and sociology. Even if we have the better understanding of our analyses, we can still fail in how we build and adapt them to our city. The presence or absence of a retail space in the ground floor,or the connection between other stores,are determined in old urban plans , in some cases published more than 40 years ago, as the case of the city of Barcelona. However, relaxing planning instead can lead to speculative movements that generate problems like gentrification, among others. With these contradictions, planning and architectural workflows need to adapt to a new ontology.
Urbban is a place of debate and solutions for the new urban agenda that requires merging new urban theories and practices. Despite many ideological arguments and theories we can distinguish some failures and achievements and put into debate how to transform obsolete parts of the cities, towns or landscape. We can now divide city into vectors and, in order to improve many urban features, get to know their performance, from the point of view of ecology, tourism, affordability, cultural heritage and many more.
Analyzing districts on many different levels and intersecting the results can bring interesting conclusions, for instance in association between built environment and health outcomes.

Discover
interactive


Wide range of factors define the identity of urban space, from environmental and economical perspectives, to history and culture, among others, urban identity is a complex subject. All these factors combined with distinctive socio-cultural values form urban character. Unfortunately, as a result of globalisation and standardization many cities have lost their uniqueness. Despite maintaining the cultural diversity we experience repetitive design void of local identity, creating a geography of nowhere, like the famous book of James Howard Kunstler.
Exploring existing datasets already allow complex urban analysis, even at a small scale like a neighborhood and help create solutions for Architecture and Urban planning. Using such tools we are able to define urban catalogs including architectonic forms, proportions, facade divisions, details and materials that are defining urban context. Creating a catalog of urban and architectural patterns we can help architects to design contextual architecture in order to maintain, sense of place, cultural heritage, while keeping transforming the city for future needs.
Map created by lexar in CARTO
Map above shows the difference from the median of urban economic activities per habitant in Berlin. This figure takes into account how many residents live every 500 radius hexagon cell, and how many urban economics business are located in the same cell. These business vary from restaurants, supermarkets or hairdressers and are taken from Berlin Open Data Portal. Green cells show values close to the city median and red ones are showing values with a higher rate of business x habitant, meaning a low density of business in that cell. Cells with no population or business are not shown in the map. Through this simple comparison we can detect urban cells lacking mixed use, and determine ways to fill the missing gaps of economic activities in these cells. .
In times of higher uncertainty caused by the pandemic situation, it is important to transform cities into places where life quality, environmental conditions, sustainability and access to activities play a central role. Through Data Science we can compare many places with similar factors and find better solutions such us the new philosophy of “15-minute cities”, where a close neighborhood should fulfill essential needs.

Urban Data Science
Explorative Data Analysis already shows many interesting insights about spatial differences between city areas. There is no direct correlation within density of economical activity and residents. Urban morphology play a key role in urban econometrics that often is not taken into account.
Spatial Data Science
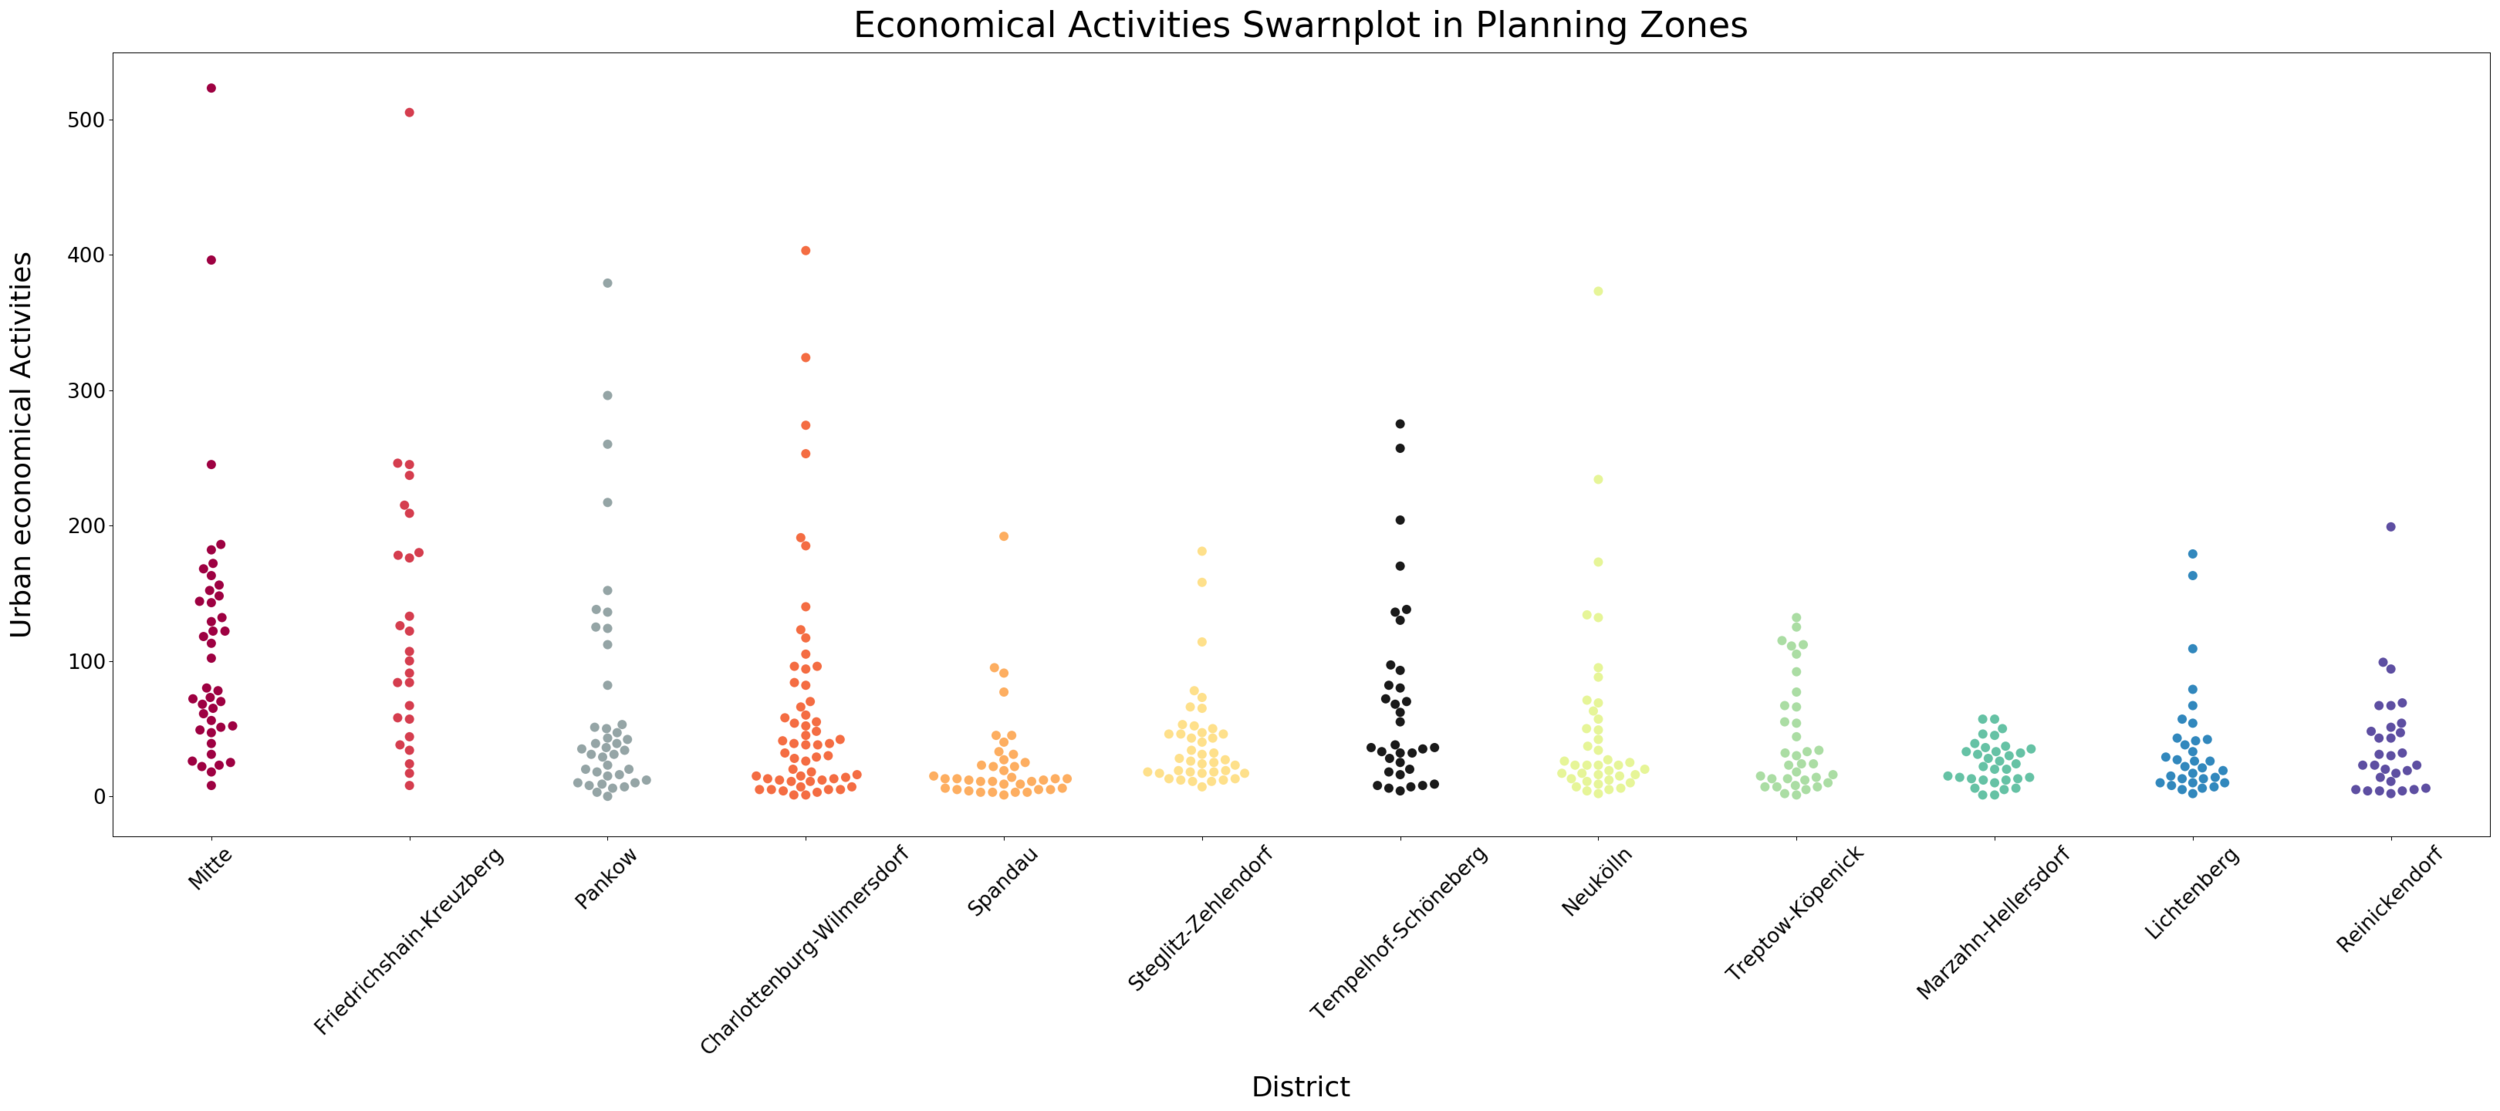
Most of data is spatialy correlated, that means that location plays an important role in explaining variability. In the right plot, a swarnplot is shown, where areas of 500 m radius in the city of Berlin determine the number of economical activities. Marzahn- Hellersdorf is the only district without a single concentration of more than 100 activities in whole land of Berlin.

Applications of Machine Learning for urban and regional planning are countless and provide many benefits to improve city governance. Despite technology and knowledge derived from machine learning models, all information needs to be treated with caution. Smart City and Slow City concepts are not forcly contradictory, The data that the smart cities concept is providing, needs to be take into account in planning processes, but not blindly followed in a technocracy paradigm. Despite the creation of city digital twins, we can still have many hidden data that is not shown in our models, that exists in other scales (metropolitan, regional, or global scale). Therefore the creations of City Information Model (CIM) still needs a long way to reap all the available information and combine it in a useful way.
IOT (Internet of Things) is key for Smart Cities and is improving transportation and logistics within cities and metropolitan areas. Knowledge graphs also allow to ingest all data with semantic information, so they even allow machines to machine communication for a better and quicker response . Knowledge Graph enable multi-modal, predictive modeling and artificial intelligence at bigger scale enabling also Spatial Big Data, which is important to correctly dimension of urban complexity tasks.
Computer Vision allows to segment in real time interesting facts about mobility, public space, in socio-temporal datasets that help to improve transportation and street design among others examples.

The liftet ground floor exposures attractive space for activities, such as cafes, restaurants, local shops, yoga studios or co-working hubs. The proposal is focusing on creating a place that combines family life, work and pleasure, not only for the people living in the building, but also for the entire neighborhood.

The building form with its facade division and roof is the modern interpretation of the typical building of the neighborhood. Mixing of the commercial and residential usage is an important approach into the good, based on “15-minute” philosophy, placemaking.

The form of the building is untypical for the neighborhood although through the setting back of the facade an attractive square with terraces will be created. The chosen form connects the calm garden and playground in the backside with green, representative public square.

Building simulation confirms that its performance including thermal comfort and sustainability are the most effective. Thanks to solar panels potential environmental footprint is the lowest, volume of the project adapts perfectly to its usage: one commercial ground floor + 4 residential floors and building costs are the most attractive.

Scenario 2 consumes much more energy and requires the highest financial outlays. The roof form adapts perfectly to the neighborhood´s image, although enlarged height of the roof level is bringing down the building performance. The continuity of facade fits into the surroundings, though building costs are not appealing.

Simulation of scenario 3 confirms that its performance including thermal comfort and sustainability are the worst. Building costs are quite low, though the volume of the project with enlarged height allows the division only into one commercial ground floor and 3 residential floors. As a result the energy consumption is rising and its economical attractiveness is going down.


Urban elements are diverse in range and play a distinct role if we are dealing with design, social or economical models. A facade in a shopping mall has a low impact on consumers, who visit the shopping mall not for the beauty of the architecture, but for the existence of stores, amenities or the proximity to their residence. But as traditional business are facing a bigger concurrence with online shopping, new paradigms are appearing to offer better urban experiences to residents and visitors. In this new paradigm of data driven business, where retail stores are creating indoor heatmaps of their customers, all architectural details play an important role.
From BIM (Building Information Modeling) we know how important is data modeling for design process. Buildings are diverse in shape and form and have different ages, materials and qualities. Maintenance, repair and improvement of buildings is not only a matter of architecture, but also of planning, performance and sustainability.
Lidar and photogrametry combined with machine learning models enables us to distinguish building parts, architectural styles, textures, and components. Facade parsing can help create a City Information Model (CIM) with rich level of detail.
Combining 2d and ·3d data in Machine Learning models can help determine the relation of sociology and architecture and improve urban participatory process with gamification and explanaible AI, interacting with residents.


