The Limits of an Historical Center
A perspective of City Center Districts
Cities around Europe are accommodating more population that tend to concentrate in bigger cities, as this trend accelerates, there is an urgent need to build more and faster which generates big tensions aggravated with the lack of affordable access to housing. City center districts (CCD) are not the areas where new housing supplies grow easier, those are already built up zones with almost no terrain left to construct and generally have more restrictions for higher density developments and the prices per square meters are usually the most expensive. CCD will face new challenges as postpandemic urbanism will change how shopping, office and real estate markets operate in those areas. Fewer offices space required could attract more land use changes from services to residential uses in CCDs.
There is indeed a global trend to expulse stationary retail business in favor of concentrate online retail services. Many uncertainties appear around constructed shopping malls or high streets and how they will adapt to postpandemic habits of less physical stores required. In Barcelona, Spain, even before the pandemic, a trend to change commercial use to residential was detected, following the decay of second and third tier commercial streets.
If this trend continues , a further polarized city will emerge, with fewer mix used zones, that combine commercial and residential uses in the same lot. Residencialization of cities and neighborhoods will continue to grow, as commercial property will be less required due to an increase in demand of online shopping. CCD concentrate the bigger mixed used zones in metropolitan areas, whether if cities are polycentric or not, they will face a new challenge facing transformation and adaptation of space to new population habits. As cities are constantly evolving and CCD have a more heterogeneous urban fabric that can adapt better to changes, CCD in most cases will not lose their appeal, but readapt with new forms and transformations. For this adaptation new urban trends like Placemaking appear as a way of transform public spaces and to anchor civic use that can have an spillover effect on economic activity. Placemaking increases the number of citizens who actively use public space and therefore augment the potential uses of leisure and commercial activities surrounding public spaces.
Inside the debate of PlaceMaking concept, new topics appear which are difficult to measure economically, like urban vibrancy, or the impact of urban fabric diversity. On the other side, as the famous book “The Geography of nowhere” popularized, current zoning approaches create some urban places that are defined as noplaces, which are far away from the principles of placemaking,but represent a fast way of producing built space in cities. Productions of those no-places is still ongoing, as the urgency of building fast and economic creates look-alike architecture with private public spaces, which will not allow visitors to interact with its surrounding space. If we add a supermarket or a mall in the vicinity, we could even create a 15 minutes city, but still not a distinctive place. Placemaking perspective needs to be taken into account in planning procedures for its potential impact in mobility and urban economics among others.
Focus on medium cities and case study
In medium cities outside metropolitan areas, the urban growth process is slower, or even we observe some tendency to lower the population, so postpandemic habits can even further damage the CCD in medium cities, by increasing population loss and retail desertification. Ideas like 15 minutes city already accommodate in small and medium cities in Europe, which are less connected to global markets and face differences related to governance and urban planning laws. In the case of Poland there are more than 150 cities above 30,000 habitants, but as many as 750 below that figure which are still considered urban centers. These small urban centers range from 1000 habitants to 30,000 and their city centers are really diverse in terms of size, heritage and urban morphology, so strategies facing new urban challenges can't be unique.
New trends in postpandemic cities also open a new opportunity for small and medium cities, so remote employees can relocate and work in a different environment. As prices are generally cheaper in smaller towns, this is a serious opportunity for balancing economic development and demographic trends between small-medium urban areas and big metropolitan areas.
In this article we will attempt to measure the limits of what is a city center with an unsupervised approach, in this case of two small city centers in West Poland. This time we are going to focus on delimiting only in the historic city center and not taking into account for this analysis economic activities like shops or restaurants.
On behalf of locating the historic city center we will look in two variables only, the age of the building and the adjacency index. In our case we will study two urban centers located in the Goleniowski district in West Poland. Goleniowski district has 6 municipalities, 4 of them are urban, including our case studies cities, the cities of Goleniów and Mazewo. Goleniów is the second most dense city of the whole province of West Pomeraniaand has a city center (“Stare Miasto”) that was completely destroyed during WWII, so delimiting its historic center is not evident. On the other side Maszewo is the municipality where the Stare Miasto center is still well-defined.
As we can see in the map of buildings constructed before 1920, divided by county of Poland, the division between East and West Poland is so evident, it greatly matches the previous areas who belonged to Prussia and the previous boundaries of Poland. Goleniów district and Sczeczin were more damaged than other cities in the West, but still have many rural properties being built before 1920. 6 municipalities of goleniowski, are plotted in red a graph below, showing number of dwellings per buildings, displaying a tendency to live in apartments or detached houses. Goleniow has an average of more than 4 dwellings per unit, which despite being the second densest city of West Pomerania doesn't situate Goleniow between the highest number in Poland of dwellings per building.
% of Buildings constructed before 1920 at county level Scatterplot (dwellings x builiding and total dwellings)


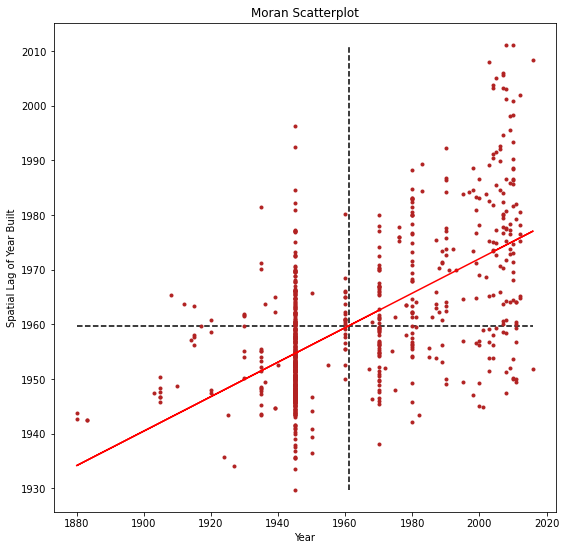
For looking at granular building data, we need to create a web scrapper that can store the data shown in the local geoportal using Selenium package of Python. For the towns of Goleniów and Maszewo, there are 4000 buildings and 700 excluding rural areas of the municipalities. The average year of construction in Goleniów is year 1974, and in Maszewo 1961 according to local geoportal. With a Moran Scatterplot consists of a plot with the spatially lagged variable on the y-axis and the original variable on the x-axis. The scatter plot is divided into four quadrants. The upper-right quadrant and the lower-left quadrant correspond with positive spatial autocorrelation (similar values at neighboring locations). In Both Maszewo and Goleniow we can observe a majority of positive Spatial correlation for buildings built before the mean year of building construction. So there is an spatial effect on building age.
Goleniow Maszewo

The other part of the analysis is the adjacency index. For that propose, we use the momepy library in Python, so this index indicates how many buildings are in a given distance and how close they are located between each other. So Adjacency index is key for understanding urban morphology, in this case the lower it is, the more buildings surrounding that unit exists.
The result is that Maszewo has a strong delimited town center, with few units on the north of the town as well with a low index, but the pattern is clearThe more concentrated area is formed about the medieval pattern streets of Stare Miasto. Goleniów, which Stare Miasto was destroyed in the WWIIand the buildings were not reconstructed according to its original historical urbanistic form, but in a post-war modernist style, a more heterogeneous context appearIn this case whiteout clear City Center defined, we can conclude that Adjacency index alone is not a sufficient parameter to define our city centers.
Goleniow Adjacency index map Maszewo Adjacency index map


So now we have two parameters to perform our analysis. But still we need to process a spatial summary of the pattern of these buildings. So we use a Moran's I Cluster Analysis,for detecting cold and hot spots and its outliers. Moran's I calculates spatial autocorrelation, so if there is a correlation between a variable and its location, it can show a concentration of lower (older buildings) or higher (new buildings), and the outliers present in those areas.
Goleniow Cluster analysis and outlier detection, building age Maszewo Cluster analysis and outlier detection


This cluster analysis is really useful for detecting older construction zones, and observe the city growth patterns. It detects not only the city center, but also older areas which were built at similar periods of time, zones which are not significant and the outliers, meaning how many new additions were developed in cold spots clusters.
Goleniow cold spots clusters (older buildings) Goleniow cold spots clusters (adjacency index)
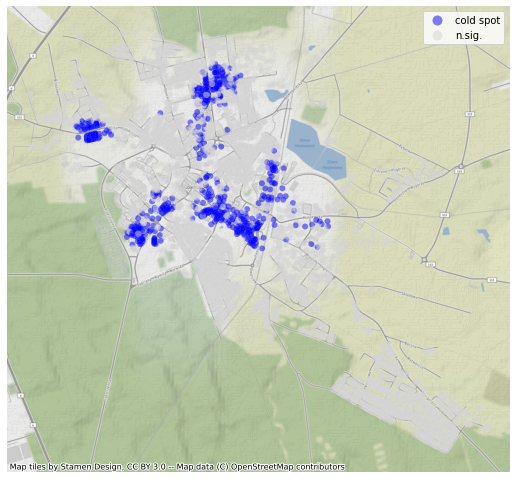

The Stare Miasto of Goleniów still concentrates some old buildings detected as a cluster, but other cold clusters appear more clearly all around Goleniow, mainly around some axes and in small concentrations in the west. With adjacency cluster analysis we also focus on cold spots, in this case a more defined map appear, with 4 to 5 clusters, that could be potential city centers.
We establish an isochrone of 50 meters around every cluster point, and dissolve this geometry into a polygon to perform an intersection of both cluster areas, adjacency cluster area and older buildings. The result is convincing.
Delimited Historical Areas in Goleniow Delimited Historical Area in Maszewo


At Goleniów we have 3 zones, that have both characteristics, where the streets of the Stare Miasto are not represented, so despite being a protected urban form, doesn’t fall in the cateogry of the Historical City Center(HCC) according to our analysis. The HCC of Goleniow is detected around the Konstytucji 3 Maja street and train station which act like a high street for Goleniow. Konstytucji 3 Maja street derives also from older urban form and is also marked in Google Maps as an interesting zone, meaning that is a part of town where people are staying / visiting more. In Maszewo the exact same procedure was conducted and the result is that Stare Miasto is equally selected as the city center. The result is that Maszewo town with 3000 residents in the city and 8000 in the municipality has a surface of 109,311 m2 of HCC, while Goleniow city has 22,000 habitants of the total 33.000inhabitants of the municipality, and 119,132 m2 of detected HCC.
It is interesting fact is that between those two towns the surfaces of urban historical centers are very similar, but the population in Goleniow is 7 times higher than in Maszewo. The idea of a historical center is romanticized as a tourist destination, but if it is not the case, an HCC can face many challenges, Historic or older buildings are more expensive to rehabilitate, also more difficult to accommodate a new use like a supermarket and such areas provide less parking spaces. The result is that developers decide to invest in other parts of the city where planning costs are less expensive and building permits easier to obtain. So Does Maszewo have any advantage of having a bigger historical center comparing to its populations that Goleniów ?.
We will need for sure a more complex analysis analyzing more cities and vectors, but we can already determine that historical areas are important for heritage, but this is not automatically translated into positive economic impact. In Goleniow a new center outside the destroyed Stare Miasto appeared and shops and amenities can accommodate there, while other two small areas with older buildings are mainly residential and do not support any direct economical activity. The same situation concerns Maszewo with fewer stores located in its historical city. The fact about having a bigger and older city center, do not translate to more economic activities. This business comparison is made without business granular data and is based on Google Maps search. As for measuring tourism only statistic data about foreign pernoctations exists, which doesn't show relevant data.
We also find the outliers inside these areas, detecting a new building constructed in historical areas, so we can examine the result of those interventions. With historical data we could determine how those infills were affecting in terms of real state prices, affordability, mobility, urban economics, landscape architecture, and a tourism attractionamong others.

Maszewo center is located inside a structure of Stare Miasto with narrow streets.

The center of Goleniow is locating instead around Konstytucji 3 Maja street, which forms a kind of High Street.

Aspect of other two pockets of old areas in Goleniow
In summary, this approach can lead to determine and detect :
· Extent of urban historical areas,
· Number of outliers in those areas
· Potential of use of Placemaking strategies
· Measure homogeneity of architectural styles
· Land use valuation
· Examine the adequacy of planning laws in those areas
· Compare Mall’s stores with urban stores
Other open questions that are coming up to answer in this analysis are:
· How to measure the adequacy of urban infill, and establishperformance indicators.
· What is the role of an historical part of the town in the 21st century?
· Comparing foot traffic of small towns?
· Establish the necessity of expansion or retraction of urban centers ?
· What is the optimal size of a City Centre
· How to create in Placemaking approach to leverage the quality of those centers beyond architectural properties?
· How to attract tourists, new residents or urban activities according to new population habits and City Center Configurations.
· How postpandemics urbanism will affect those areas?
· How to measure economic vibrancy?
· Detectings opportunities of transformations of commercial space inside center areas?
Conclusion
The data analysis of cities can have a huge impact not only on big cities, but also on second and third tier ones. Comparing data between cities, both nationally and internationally, is the key to understand the future of planning transportation, urbanism and sustainability. Smart Cities is a top-down approach that articulates a strategy with data, but as we know complexity science do not allow simple questions, so introducing concepts like Placemaking can help cities in activating economic solutions to face new threats in postpandemic times. City Centers whether in big metropolitan areas will play a central role in addressing future planning trends. Delimiting their size is just a small step to derive new policies that we believe need to be linked with a common practice between design and data analysis.